Multi-Model AI Engine
Select and compare XGBoost, Random Forest, LSTM, and CatBoost across multiple tickers with unified evaluation reports.
Case Study
Investment intelligence that lets traders simulate, compare, and deploy AI models with institutional rigor.
User Impact
Traders, quants, and fintech teams launch experiments and publish signals without needing ML engineers.
AI Core
Model zoo with LSTM, CatBoost, Random Forest, and GPU-ready PyTorch pipelines.
An AI-driven investment intelligence platform that simplifies the quantitative workflow. Users ingest market data, engineer features, compare models, and deploy signals using an intuitive studio backed by institutional-grade metrics.
The Challenge
Legacy tools were opaque, slow, and limited—making it impossible to experiment across models, validate time series correctly, or benchmark performance in real time.
Backtesting suites demanded heavy scripting for simple experiments.
Explainability was minimal, hiding feature influence and model decision paths.
Comparing neural, ML, and statistical models on live datasets was nearly impossible.
Time-series validation and normalization pipelines were fragile and manual.
Performance dashboards lacked financial KPIs such as drawdown and Sharpe ratio.
The Solution
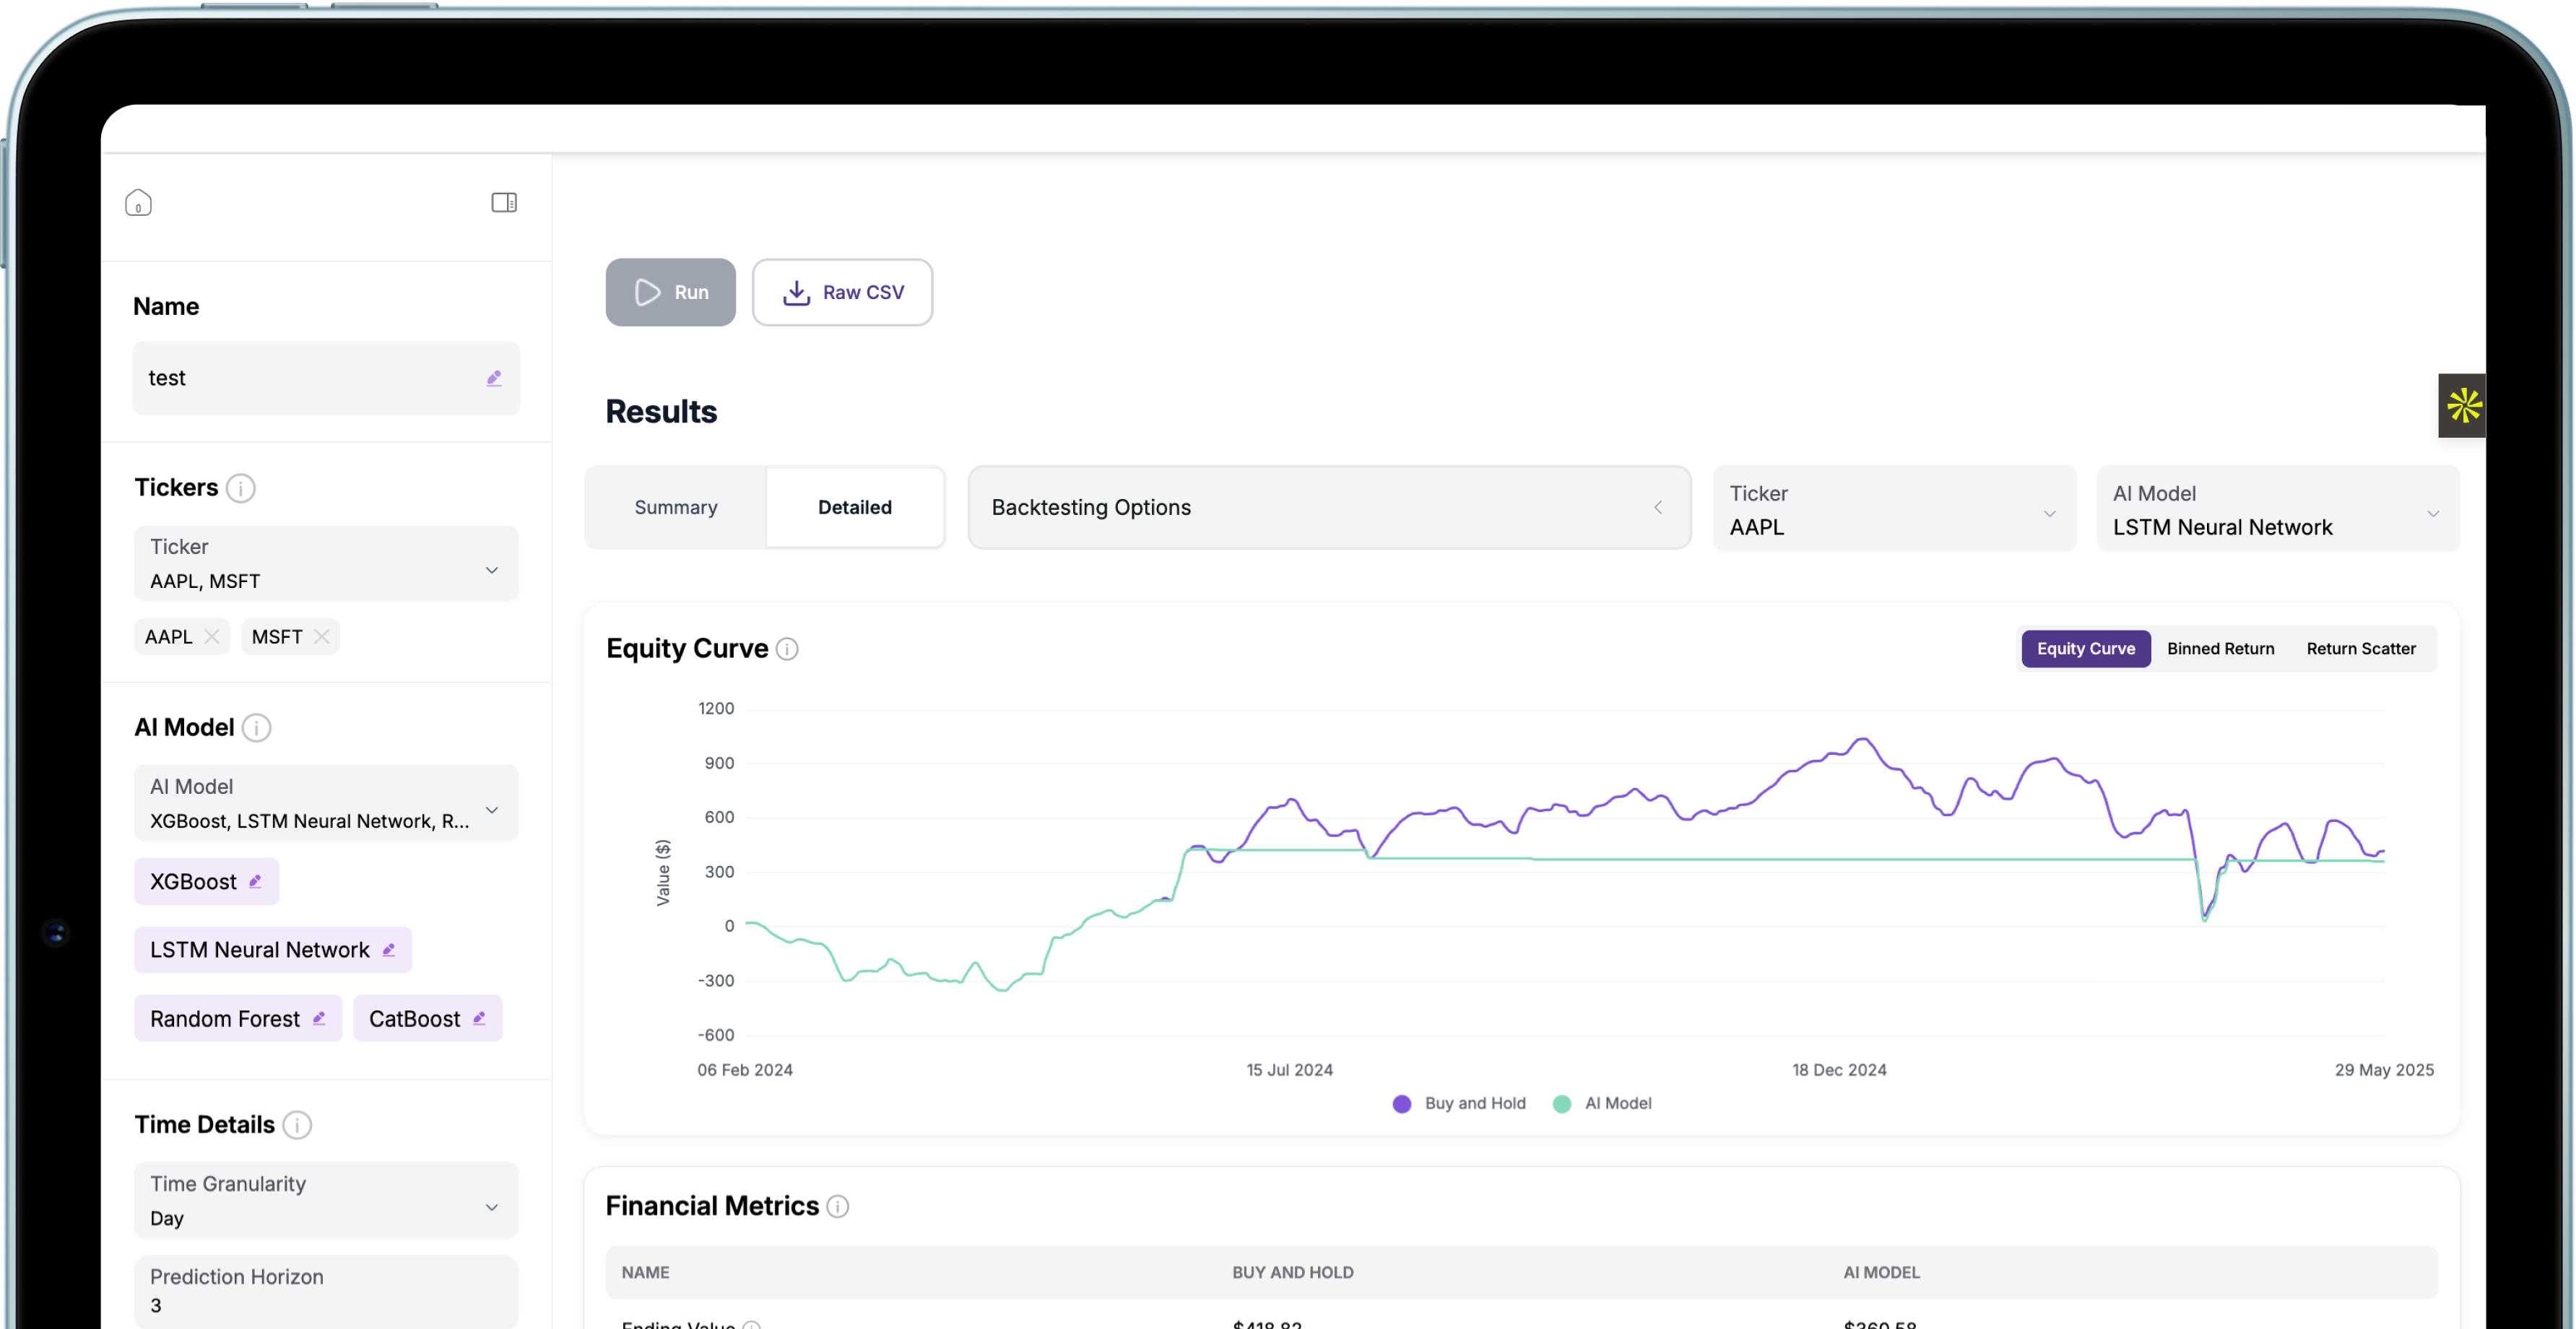
Select and compare XGBoost, Random Forest, LSTM, and CatBoost across multiple tickers with unified evaluation reports.
Real-time simulation with walk-forward validation, adjustable prediction horizons, and aggregation controls.
Interactive charts comparing Buy & Hold vs AI models with drawdown, Sharpe, and risk-adjusted KPIs.
Automated profitability, precision, recall, AUC-ROC, F1, and risk indicator calculations on every run.
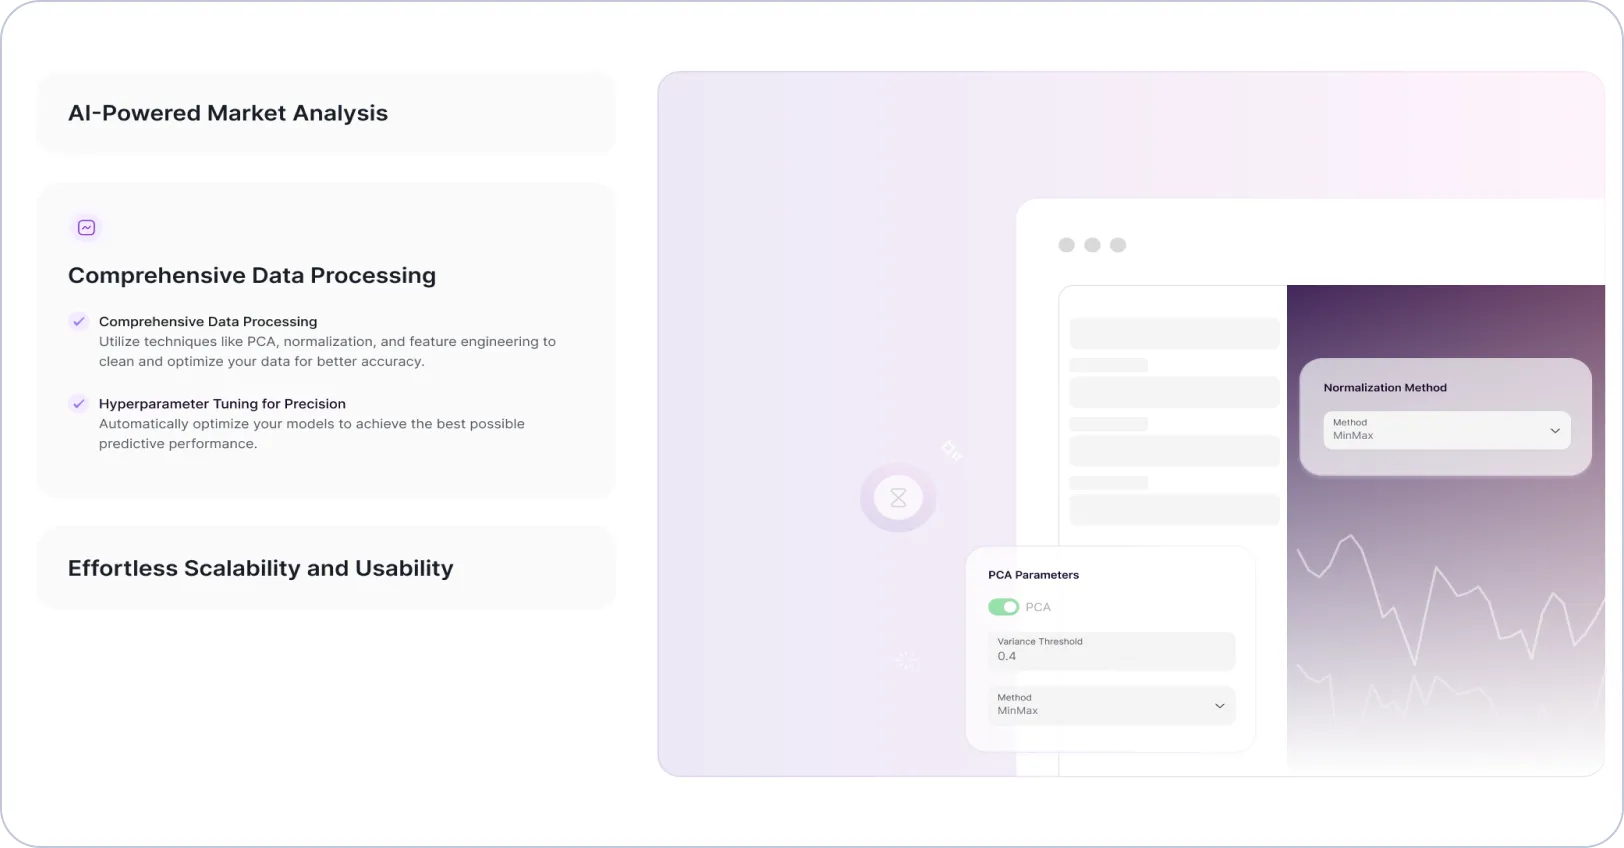
Normalize and transform price/volume features, apply Min-Max scaling or PCA with instant previews.
One-click export of datasets, configuration, and results for institutional reporting and downstream analysis.
Experience Re-Imagined
The Impact
0%
Setup Time Reduction
6–8 hours → <15 minutes
0×
Daily Backtests
3–5 → 30+ iterations
0%
Accuracy Improvement
Out-of-sample accuracy 48% → 65%+
0+
Concurrent Analysts
Cloud-native scaling without slowdown
“We went from scattered notebooks to an AI lab that quantifies every trade-off—now our analysts iterate ten times faster with full transparency.” — Head of Quantitative Research, Global Trading Desk
Technology Stack
Designed for secure, explainable, and scalable quantitative workflows.
Key Advantage